In order to get a more precise idea on how the MCH occupancy is behaving, I’ve started to develop a new DA, MCHBPEVOda, that will monitoring the bus patch occupancy as a function of time. Possibly it will also issue, on regular basis, a list of “faulty” bus patches (BP with too high occupancy). In turn, that list could be used online to remove those bus patches from the configuration, on-the-fly.
The (monitoring) DA decode raw data events and count the number of times each bus patch is hit, within a given time window, called the time resolution. The configuration file of the DA allows to specify the time resolution(s), which is 60 seconds by default. Every given (configurable) number of (used) events (1000 by default), that hit count is converted into the occupancy of each bus patch. That occupancy is compared to a (configurable) threshold, and a message is issued for each bus patch above the threshold.
Test method
The DA is developped with AliRoot in a SLC6 VMware Fusion 7 Pro machine on my MacBook Pro. To test it on a data sample large enough, here’s the procedure :
- modified the deroot program (see JIRA ALIROOT-6278) to be able to read a collection of input files, instead of just one,
- made use of the filtering facility of the SAF2 to stage (filtered) RAW data of complete runs,
- create one (two, for Run1 data, i.e. data with CDH v2) FIFO pipe : mknod /tmp/deroot p (mknod /tmp/mpconvert p)
- in one terminal, launch the deroot program to run on a collection of files (ideally all the files of one run), and send the output to a FIFO
deroot collection://filelist.txt /tmp/deroot
- (only for CDH v2 data), in another terminal, launch the mpconvert program to run from /tmp/deroot and send its output to the FIFO /tmp/mpconvert
/date/monitoring/Linux/mpConvert /tmp/deroot /tmp/mpconvert
- in yet another terminal, launch the DA to read from the FIFO (either /tmp/deroot for recent data or /tmp/mpconvert for CDH v2) :
MCHBPEVOda.exe /tmp/deroot "start-date" output.root
Note the DA, when used locally, must be given the start date of the considered run to get the reference time where to start the histograms time-axis. Online, this reference time will be the start time of the DA executable. Optionally, the last parameter gives the name of the output Root file (mchbpevo.root if not given).
The output file contains one AliMergeableCollection (named bpevo) containing, for each time resolution chosen, 889 histograms : 1 for hits count per bus patch + 1 for the number of events in each time bin.
root [2] bpevo.Print("*")

(TH1F)     Nevents60s | Number of events 60 s bins | Entries=84002 Sum=84002

/BUSPATCH/HITS/60s/
  (TH1F)     BP0001 | Number of hits in 10 s bins | Entries=26797 Sum=63292
  (TH1F)     BP0002 | Number of hits in 10 s bins | Entries=26011 Sum=57671
  (TH1F)     BP0003 | Number of hits in 10 s bins | Entries=31095 Sum=71150
  (TH1F)     BP0004 | Number of hits in 10 s bins | Entries=39008 Sum=91357
 etc...
To ease the interpretation, the ComputeOccupancies function of the MCHBPEVOdaUtils.C macro (in $ALICE_ROOT/../src/MUON/DA), can be used to produce some more histograms. The number of pads is put into histograms, for each detector part (bus patch, detection element, DDL, chamber, station, the last two have a left and a right version as well). For every detector part, the occupancy is then computed from the hits counts.
/BUSPATCH/HITS/60s/
/BUSPATCH/NPADS/
/BUSPATCH/OCC/60s/
/CHAMBER/HITS/60s/
/CHAMBER/NPADS/
/CHAMBER/OCC/60s/
/DDL/HITS/60s/
/DDL/NPADS/
/DDL/OCC/60s/
/DE/HITS/60s/
/DE/NPADS/
/DE/OCC/60s/
/STATION/HITS/60s/
/STATION/NPADS/
/STATION/OCC/60s/
Some results
LHC15i : run 235201, 31 minutes-long run
First, start with a global view : the occupancy time evolution of the stations (black : full station, red : right part, blue : left part).
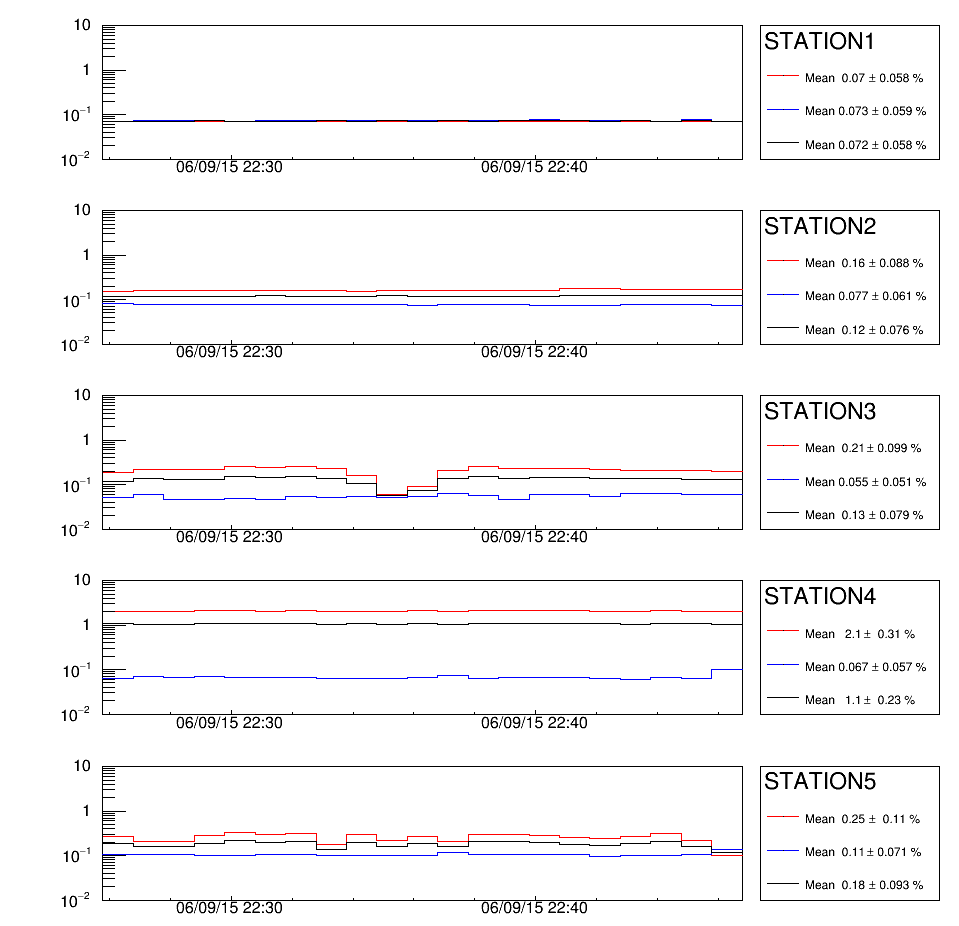
We see that something strange happened about half-way into the run with Station3, and the occupancy of Station4 (right) is pretty high. Let’s have a closer look at their chambers.
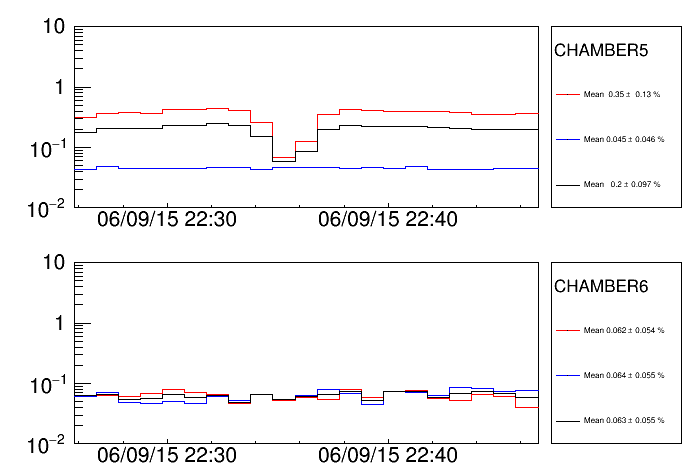
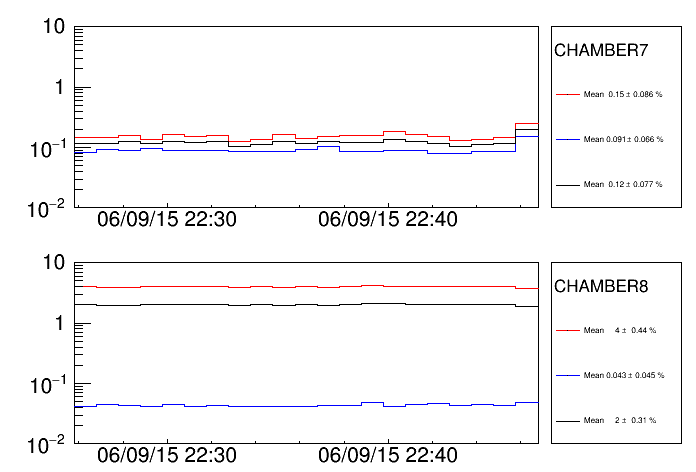
So the culprits are CH5R and CH8R. Continuing to go down, we get to the detection elements :
- DE 0517 with an occupancy around 2% and a dip in the middle of the run
- DE 0820 (7%), 821 (33%), 822 (9%), 823 (25%)
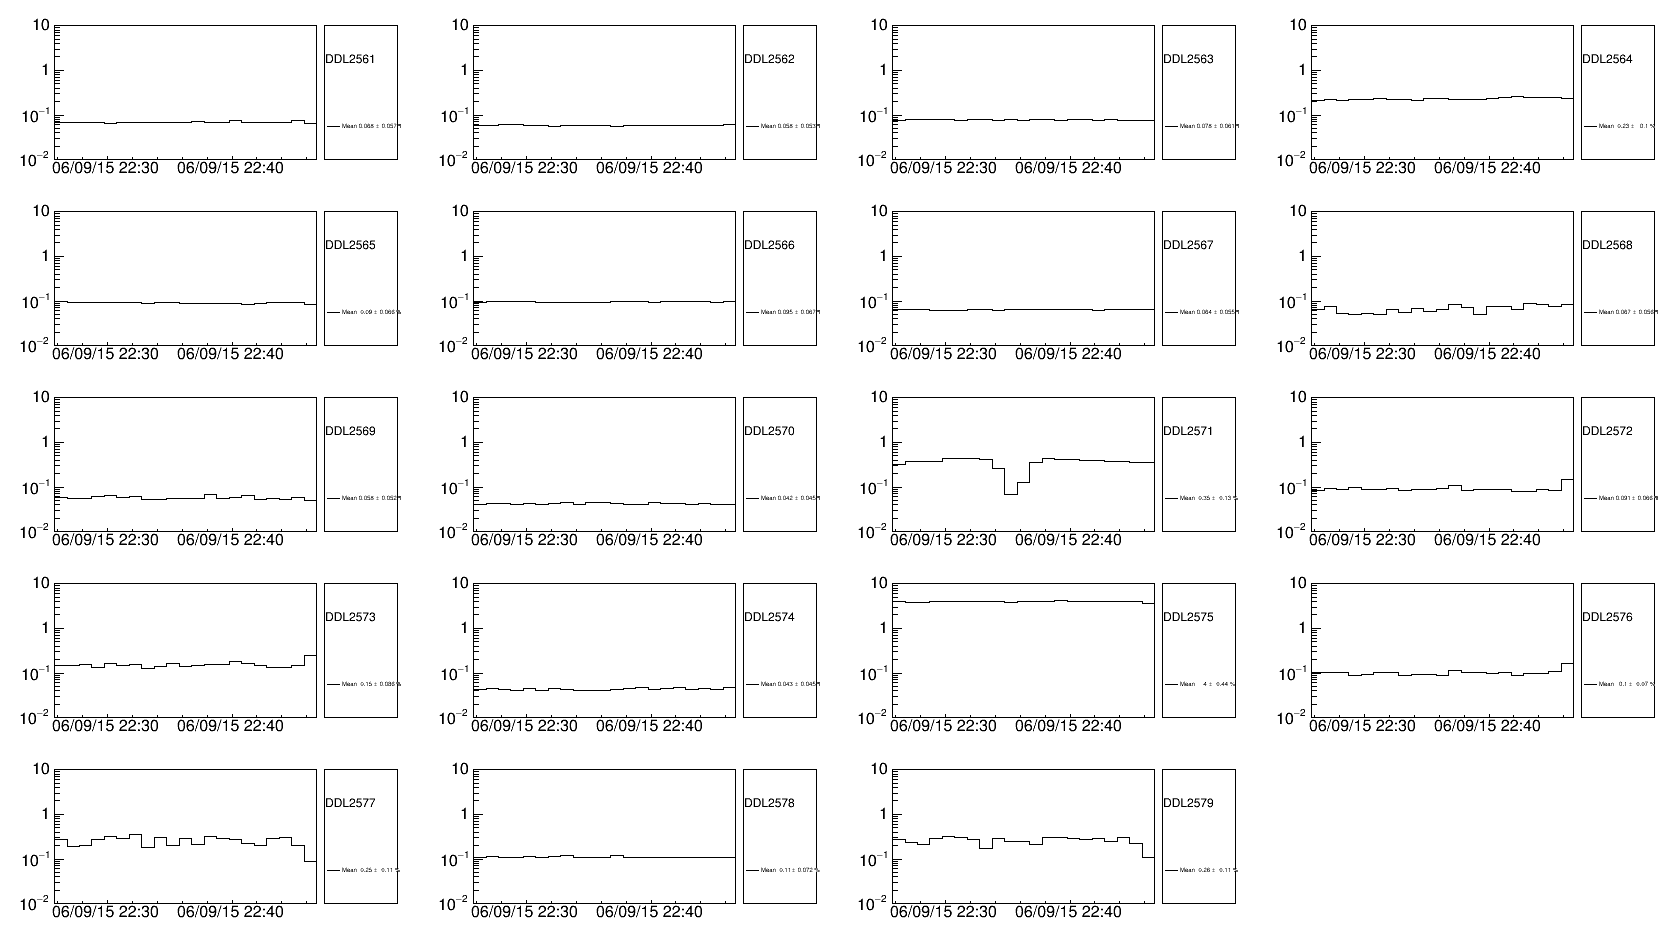
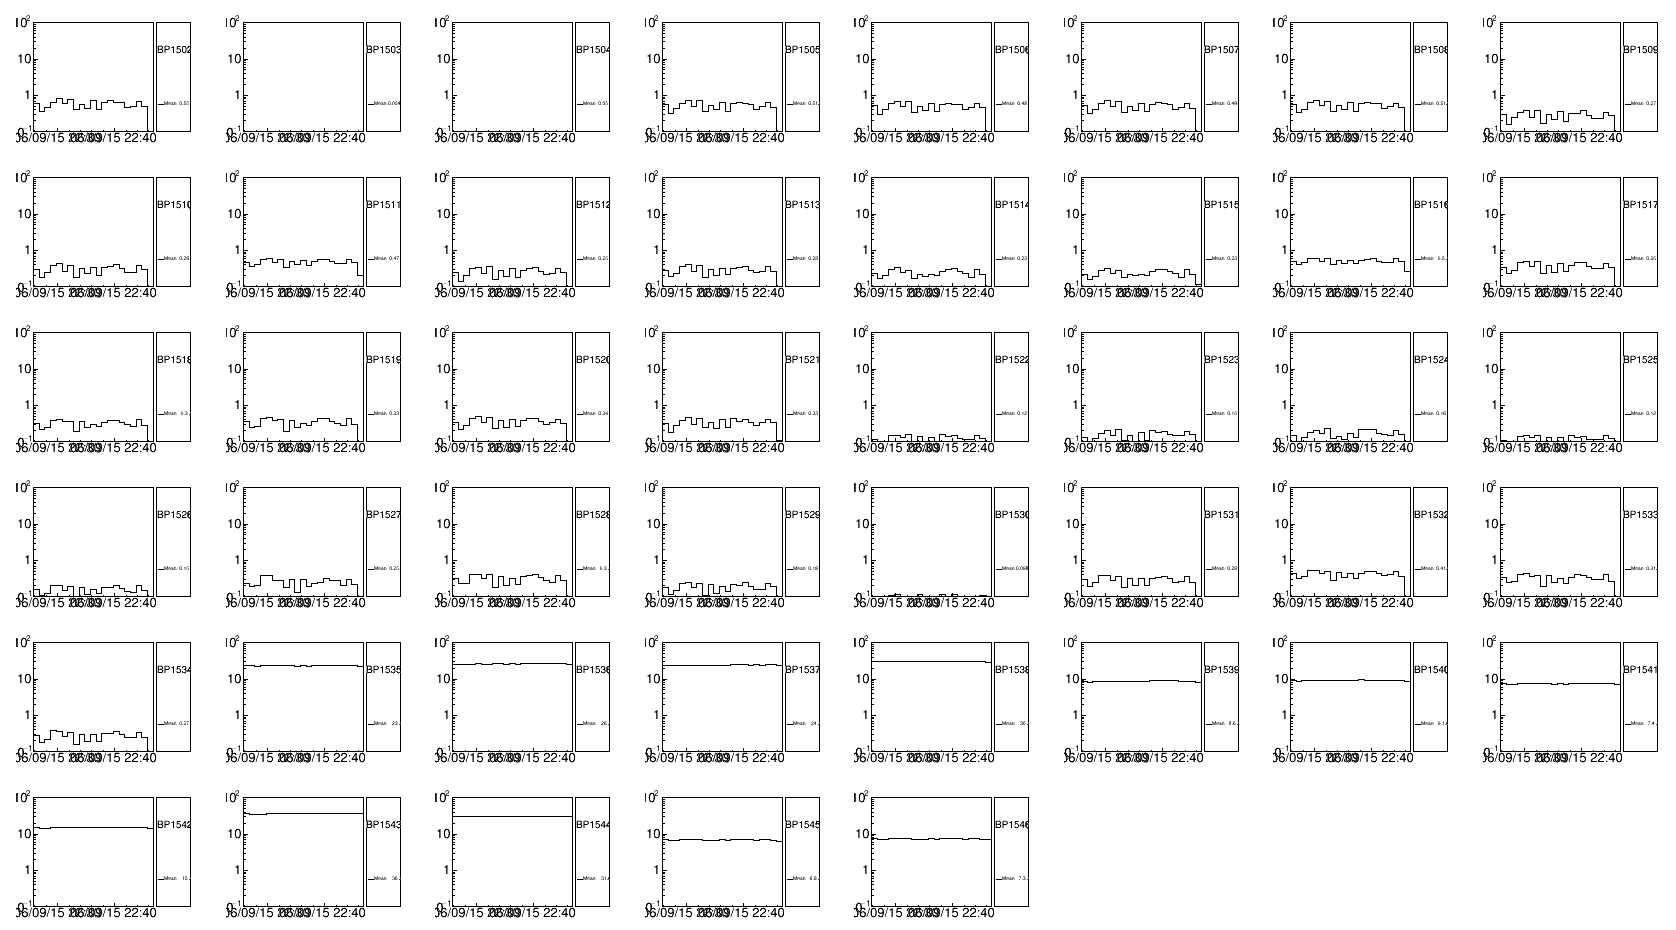
and finally to the faulty bus patches…
- BP1108 and 1107 with the dip
- BP1535 to 1544 (almost all of bottom CH8R, except for DE0824), DDL 2575